
Business intelligence has evolved far beyond dashboards and charts. Today, organizations rely on analytics platforms to automate reporting, uncover trends, improve forecasting, and make AI-driven business decisions.
However, choosing the right reporting platform can be challenging. Many companies compare Power BI vs Looker vs Tableau, but the best option depends on your existing technology stack, business goals, scalability requirements, and budget.
For organizations already using Microsoft technologies such as Dynamics 365, Microsoft 365, Azure, SQL Server, or Power Platform, the decision often becomes much clearer.
This guide compares Power BI, Looker, and Tableau from every important angle—including features, integrations, AI capabilities, pricing, scalability, governance, and business value—so you can confidently select the right reporting solution.
Why Choosing the Right BI Platform Matters
Modern organizations generate massive volumes of operational data.
Without a centralized reporting platform, businesses often experience:
- Siloed information
- Manual reporting
- Slow decision-making
- Duplicate reports
- Poor KPI visibility
- Inconsistent data governance
- Limited executive insights
An enterprise-grade BI platform helps organizations:
- Build real-time dashboards
- Connect multiple data sources
- Automate reporting
- Improve forecasting
- Enable self-service analytics
- Standardize KPIs
- Support AI-powered decision making
Choosing the right platform today can save thousands of hours over the coming years.
Understanding the Three Platforms
| Platform | Company | Best For |
|---|---|---|
| Power BI | Microsoft | Microsoft-based businesses |
| Looker | Google Cloud | Cloud-native organizations using BigQuery |
| Tableau | Salesforce | Advanced visual analytics |
Although all three platforms solve reporting challenges, they take very different approaches.
What is Microsoft Power BI?
Microsoft Power BI is Microsoft’s enterprise business intelligence platform.
It allows businesses to transform raw data into interactive dashboards and reports while integrating seamlessly with Microsoft products.
Power BI includes:
- Power BI Desktop
- Power BI Service
- Power BI Mobile
- Power BI Report Server
- Fabric Integration
- AI Insights
- Copilot AI
It has become one of the most widely adopted BI tools worldwide because of its affordability, scalability, and Microsoft ecosystem integration.
What is Looker?
Looker is Google’s cloud-based business intelligence platform.
Unlike traditional BI tools, Looker emphasizes centralized data modeling using LookML, allowing organizations to create reusable business logic across reports.
Looker performs exceptionally well within Google Cloud environments, particularly with BigQuery.
What is Tableau?
Tableau is one of the pioneers in modern data visualization.
It is well known for:
- Interactive dashboards
- Drag-and-drop analytics
- Advanced visualizations
- Large enterprise deployments
Organizations that require highly customized visual storytelling often choose Tableau.
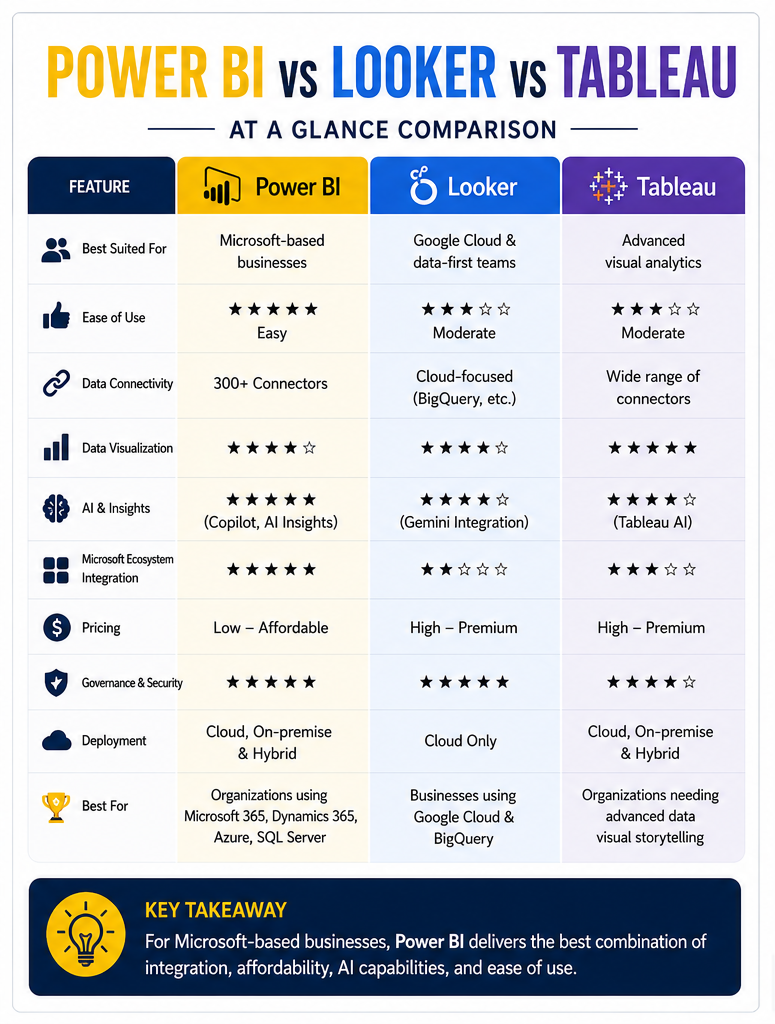
Power BI vs Looker vs Tableau: Feature Comparison
| Feature | Power BI | Looker | Tableau |
|---|---|---|---|
| Microsoft Integration | ⭐⭐⭐⭐⭐ | ⭐⭐ | ⭐⭐⭐ |
| Google Cloud Integration | ⭐⭐⭐ | ⭐⭐⭐⭐⭐ | ⭐⭐⭐ |
| Data Visualization | ⭐⭐⭐⭐ | ⭐⭐⭐⭐ | ⭐⭐⭐⭐⭐ |
| AI Features | ⭐⭐⭐⭐⭐ | ⭐⭐⭐⭐ | ⭐⭐⭐⭐ |
| Self-Service Reporting | ⭐⭐⭐⭐⭐ | ⭐⭐⭐ | ⭐⭐⭐⭐ |
| Learning Curve | Easy | Moderate | Moderate |
| Pricing | Low | High | High |
| Enterprise Governance | Excellent | Excellent | Excellent |
| Power Platform Integration | Native | Limited | Limited |
| Microsoft Fabric Support | Native | No | No |
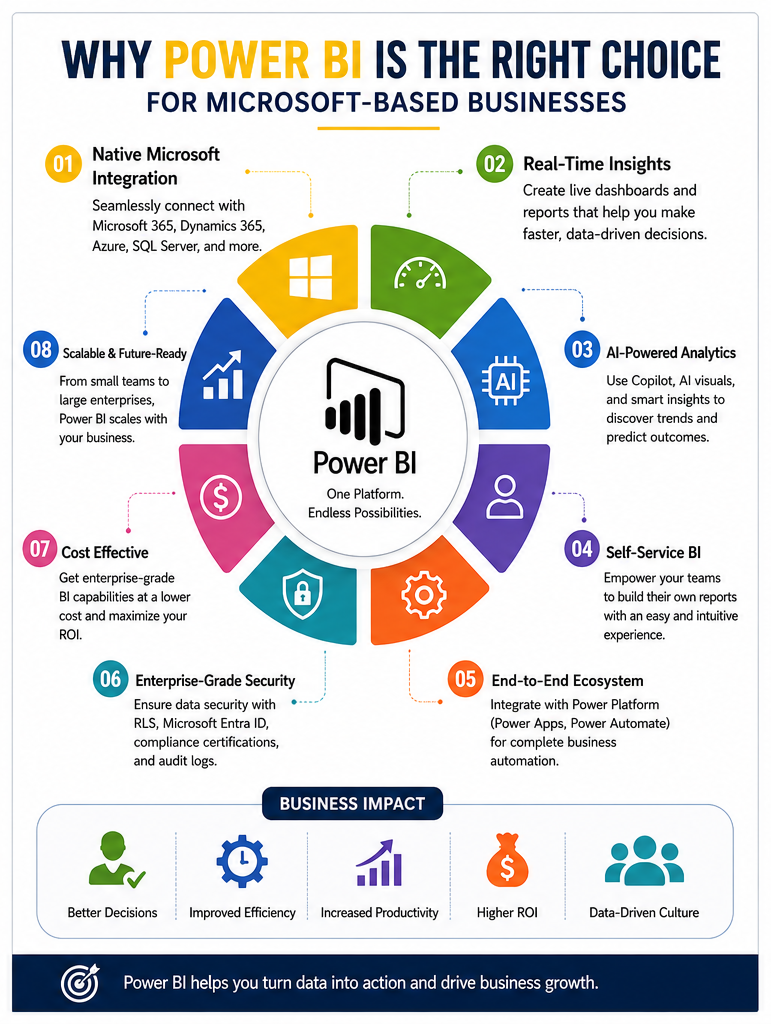
Why Power BI Is Ideal for Microsoft-Based Businesses
Organizations using Microsoft technologies gain significant advantages with Power BI.
These include:
Native Dynamics 365 Integration
Power BI connects directly with:
- Sales
- Customer Service
- Finance
- Business Central
- Supply Chain
- Marketing
As a result, dashboards update automatically without extensive custom development.
Microsoft 365 Connectivity
Power BI integrates directly with:
- Excel
- Teams
- SharePoint
- Outlook
- OneDrive
Therefore, employees can collaborate without switching between multiple applications.
Azure Integration
Businesses using Azure benefit from direct connectivity with:
- Azure SQL
- Synapse Analytics
- Data Lake
- Azure Machine Learning
- Azure AI
- Microsoft Fabric
Consequently, enterprise reporting becomes significantly more scalable.
Power Platform Integration
Power BI works seamlessly alongside:
- Power Apps
- Power Automate
- Copilot Studio
- Dataverse
This enables organizations to build complete business automation solutions instead of standalone dashboards.
Comparing Visualization Capabilities
Visualization quality often influences BI platform selection.
| Capability | Power BI | Looker | Tableau |
|---|---|---|---|
| Interactive Dashboards | Excellent | Excellent | Excellent |
| Custom Charts | Good | Moderate | Excellent |
| Geographic Maps | Excellent | Good | Excellent |
| Executive Dashboards | Excellent | Good | Excellent |
| Drill-down Reports | Excellent | Excellent | Excellent |
| Storytelling | Good | Moderate | Excellent |
Although Tableau offers the richest visual customization, Power BI provides more than enough capability for most enterprise reporting scenarios.
AI Features Comparison
Artificial intelligence is rapidly becoming a standard feature in reporting platforms.
| AI Capability | Power BI | Looker | Tableau |
|---|---|---|---|
| Natural Language Queries | ✅ | ✅ | ✅ |
| AI Forecasting | ✅ | Limited | ✅ |
| Copilot Integration | ✅ | Gemini Support | Tableau AI |
| Automated Insights | ✅ | ✅ | ✅ |
| Predictive Analytics | ✅ | Moderate | Good |
For Microsoft users, Power BI Copilot delivers exceptional productivity by allowing users to generate reports using natural language.
Data Connectivity Comparison
Power BI supports more than 300 data connectors, including:
- SQL Server
- Oracle
- SAP
- Dynamics 365
- Salesforce
- Excel
- SharePoint
- Azure
- PostgreSQL
- MySQL
- APIs
- REST Services
Looker primarily focuses on cloud databases, while Tableau supports many enterprise connectors but often requires additional configuration.
Security and Governance
Enterprise organizations require strict governance.
Power BI includes:
- Row-Level Security (RLS)
- Microsoft Entra ID authentication
- Data Loss Prevention
- Sensitivity Labels
- Compliance Certifications
- Audit Logs
These capabilities make Power BI especially attractive for regulated industries.
Pricing Comparison
| Platform | Entry Cost | Enterprise Cost |
|---|---|---|
| Power BI | Lowest | Affordable |
| Tableau | High | High |
| Looker | Custom Pricing | Premium |
Power BI consistently provides the best return on investment, especially for small and medium-sized businesses.
Performance Comparison
| Category | Winner |
|---|---|
| Large Enterprise Reporting | Power BI |
| Advanced Visual Design | Tableau |
| Google Cloud Analytics | Looker |
| Microsoft Integration | Power BI |
| Cost Efficiency | Power BI |
| Business Automation | Power BI |
Which Tool Is Easier to Learn?
Power BI has a familiar interface for users already comfortable with Excel and other Microsoft products.
Power BI
Pros
- Short learning curve
- Excel-like experience
- Extensive documentation
- Large community
Tableau
Pros
- Strong visual capabilities
Cons
- More advanced interface
- Longer onboarding
Looker
Pros
- Centralized modeling
Cons
- Requires knowledge of LookML
- Better suited for technical teams
When Should You Choose Power BI?
Power BI is the ideal choice if your organization:
- Uses Microsoft 365
- Runs Dynamics 365 CRM
- Uses Azure services
- Needs affordable enterprise BI
- Wants AI-powered reporting
- Plans to automate business processes
- Requires executive dashboards
- Needs secure governance
- Wants rapid deployment
When Looker May Be Better
Looker may be a better fit if:
- Your infrastructure is built around Google Cloud.
- BigQuery is your primary data warehouse.
- Your team is comfortable with LookML.
- You need centralized semantic modeling.
When Tableau Makes Sense
Tableau is a strong option if:
- Your organization prioritizes advanced visual storytelling.
- Data analysts require highly customized dashboards.
- Budget is less of a concern.
- Reporting teams already have Tableau expertise.
Why Microsoft Businesses Usually Choose Power BI
For organizations invested in Microsoft technologies, Power BI delivers unmatched value because it integrates naturally with the tools employees already use every day.
Its combination of affordability, enterprise security, AI capabilities, and low-code development makes it an excellent long-term reporting platform.
Rather than purchasing separate solutions for reporting, automation, and analytics, businesses can unify these capabilities within the Microsoft ecosystem.
How Sky Soft Connections Helps Businesses Succeed with Power BI
At Sky Soft Connections, we help organizations unlock the full potential of Microsoft business intelligence solutions.
Our Power BI services include:
- Power BI implementation
- Executive dashboard development
- Microsoft Dynamics 365 reporting
- Power BI migration
- Data warehouse integration
- SQL and Azure connectivity
- KPI dashboard design
- Power BI governance
- AI-powered analytics
- Report optimization
- Custom data models
- Employee training and support
Whether you are replacing spreadsheets, modernizing legacy reports, or implementing enterprise analytics, our Microsoft experts deliver scalable reporting solutions tailored to your business goals.
Frequently Asked Questions
For Microsoft-based businesses, Power BI is generally the better choice because it offers native integration with Microsoft products, lower licensing costs, and robust AI capabilities. Tableau remains a great option for organizations focused on advanced data visualization.
Looker excels in Google Cloud environments, especially when using BigQuery. However, Power BI is often the preferred solution for businesses relying on Microsoft technologies due to its seamless ecosystem integration.
Power BI is the best reporting tool for Dynamics 365 because it provides built-in connectors, real-time dashboards, and native integration with Microsoft services.
Yes. Power BI can automate data collection, create interactive dashboards, and reduce manual spreadsheet work while offering more scalable reporting capabilities.
Absolutely. Power BI provides enterprise-grade analytics at a competitive price, making it an excellent option for startups, SMEs, and large organizations alike.
Final Thoughts
When comparing Power BI vs Looker vs Tableau, there is no universal winner. The right platform depends on your technology ecosystem, reporting needs, and long-term strategy.
For businesses built on Microsoft technologies, Power BI stands out as the most practical, cost-effective, and future-ready solution. Its deep integration with Dynamics 365, Microsoft 365, Azure, and the Power Platform enables organizations to streamline reporting, automate workflows, and leverage AI-driven insights all within a familiar environment.
If your goal is to create a connected, scalable, and intelligent reporting ecosystem, partnering with Sky Soft Connections ensures your Power BI implementation is optimized for performance, security, and business growth. With expertise in Microsoft Dynamics 365, Power Platform, Azure, and custom BI solutions, Sky Soft Connections helps businesses transform data into actionable insights that drive smarter decisions.
Read more : Agentic AI Explained: What Autonomous AI Agents Mean for CRM and Business Automation in 2026