Table of Content
In business, timing is everything. When sales trends shift in hours— not weeks—static, end‑of‑month reports leave you reacting instead of leading. Microsoft Dynamics CRM flips that script. Its real‑time reporting engine gives you live data, tailored to your exact KPIs, so you can act while it still matters. In this post, you’ll discover how custom reporting in Dynamics CRM turns raw data into rapid decisions—and learn practical tips to build your own dashboards without slowing down performance.
Why Real‑Time Reporting Matters Today
Although traditional reports still have their place, decision‑makers now expect insight in the same instant they ask a question. Real‑time dashboards satisfy four critical needs:
- Speed – Spot revenue dips or pipeline spikes the moment they happen, not at quarter‑close.
- Accuracy – Work from a single source of truth that pulls directly from live CRM data.
- Agility – Pivot campaigns or reassign resources before minor issues snowball.
- Transparency – Share clear visuals with stakeholders, so everyone rows in the same direction.
“Data that arrives too late is noise. Data that arrives on time is power.”
The Built‑In Power of Dynamics CRM Reports
Dynamics 365 ships with dozens of out‑of‑the‑box charts, lists, and KPIs. They cover common needs—open opportunities, case resolution times, lead conversion rates, and more. However, modern teams rarely fit a one‑size‑fits‑all mold. That’s where custom reporting steals the spotlight.
Standard vs. Custom: A Quick Comparison
| Feature | Standard Reports | Custom Reports |
|---|---|---|
| Setup Time | Minutes | Varies (simple to advanced) |
| Flexibility | Limited fields & visuals | Unlimited drill‑downs, calculated metrics |
| Branding Control | Basic | Full—match company style guide |
| Real‑Time Refresh | Every user refresh | Live auto‑refresh options |
| Integration with Power BI | View‑only | Deep interactive embeds |
Key takeaway: Start with built‑ins for speed, then layer custom reports to answer the strategic questions unique to your business.
Building Custom Reports That Drive Action
Creating a flashy chart is easy. Creating a chart that changes behaviour requires a deliberate process. Follow the roadmap below to design dashboards that directly support your goals.
1. Clarify Your Intent
Define the exact decision each report must influence. For example:
- Which campaigns generate the highest qualified leads per dollar?
- When do opportunities stall most often in the funnel?
2. Identify the Right Data Points
Map KPIs to CRM entities and fields. Common pairings include:
- Opportunity Stage → Time in stage, probability to close
- Contact Source → Lead qualification rate
- Case Origin → Average resolution time
3. Choose Your Reporting Method
| Method | Best For | Skill Level |
| Advanced Find & Charts | Quick visual snapshots | Beginner |
| Power BI Embedded | Interactive, cross‑entity analysis | Intermediate |
| SQL Server Reporting Services (SSRS) | Pixel‑perfect PDFs, scheduled emails | Advanced |
| FetchXML‑based reports | Complex filters without SQL access | Intermediate |
4. Design for Readability
- Use contrasting colours sparingly; let white space breathe.
- Limit each dashboard page to 5–7 visuals.
- Write headings as actions: “Opportunities at Risk (Past 30 Days)”.
- Enable tooltips so users see context without leaving the screen.
5. Automate Distribution
Dynamics CRM workflows or Power Automate can push snapshots to Teams, Outlook, or even WhatsApp. Decision‑makers stay informed without chasing links.
Technical Deep Dive: Tools & Techniques
Power BI Integration
Connect Dynamics 365 to Power BI in a few clicks. Then:
- Blend CRM data with marketing spend from Excel or Google Ads.
- Use DAX measures for on‑the‑fly calculations (e.g., win‑rate by quarter).
- Publish secure, role‑based dashboards back into Dynamics—no context‑switching.
FetchXML Builder
Need to filter on N:N relationships or custom entities? FetchXML Builder (a free XrmToolBox add‑in) lets you craft complex queries without writing SQL. Export the XML, drop it into an SSRS template, and you’re done.
SSRS with Report Authoring Extension
For board‑level PDFs, SSRS still reigns. The Report Authoring Extension lets you pull Dynamics entities directly into Visual Studio. Build once, schedule forever.
Real‑World Win: From 10‑Day Lag to Same‑Day Action
A mid‑size energy supplier used to export CSV files every Friday, then massage them in Excel. Decisions landed the following Tuesday—roughly a 10‑day feedback loop. After switching to custom real‑time dashboards in Dynamics CRM + Power BI, account managers saw contract‑renewal alarms instantly. As a result, churn dropped by 18 % in one quarter while upsell revenue jumped $250k.
Lesson learned: Real‑time insight shrinks the gap between data and dollar.
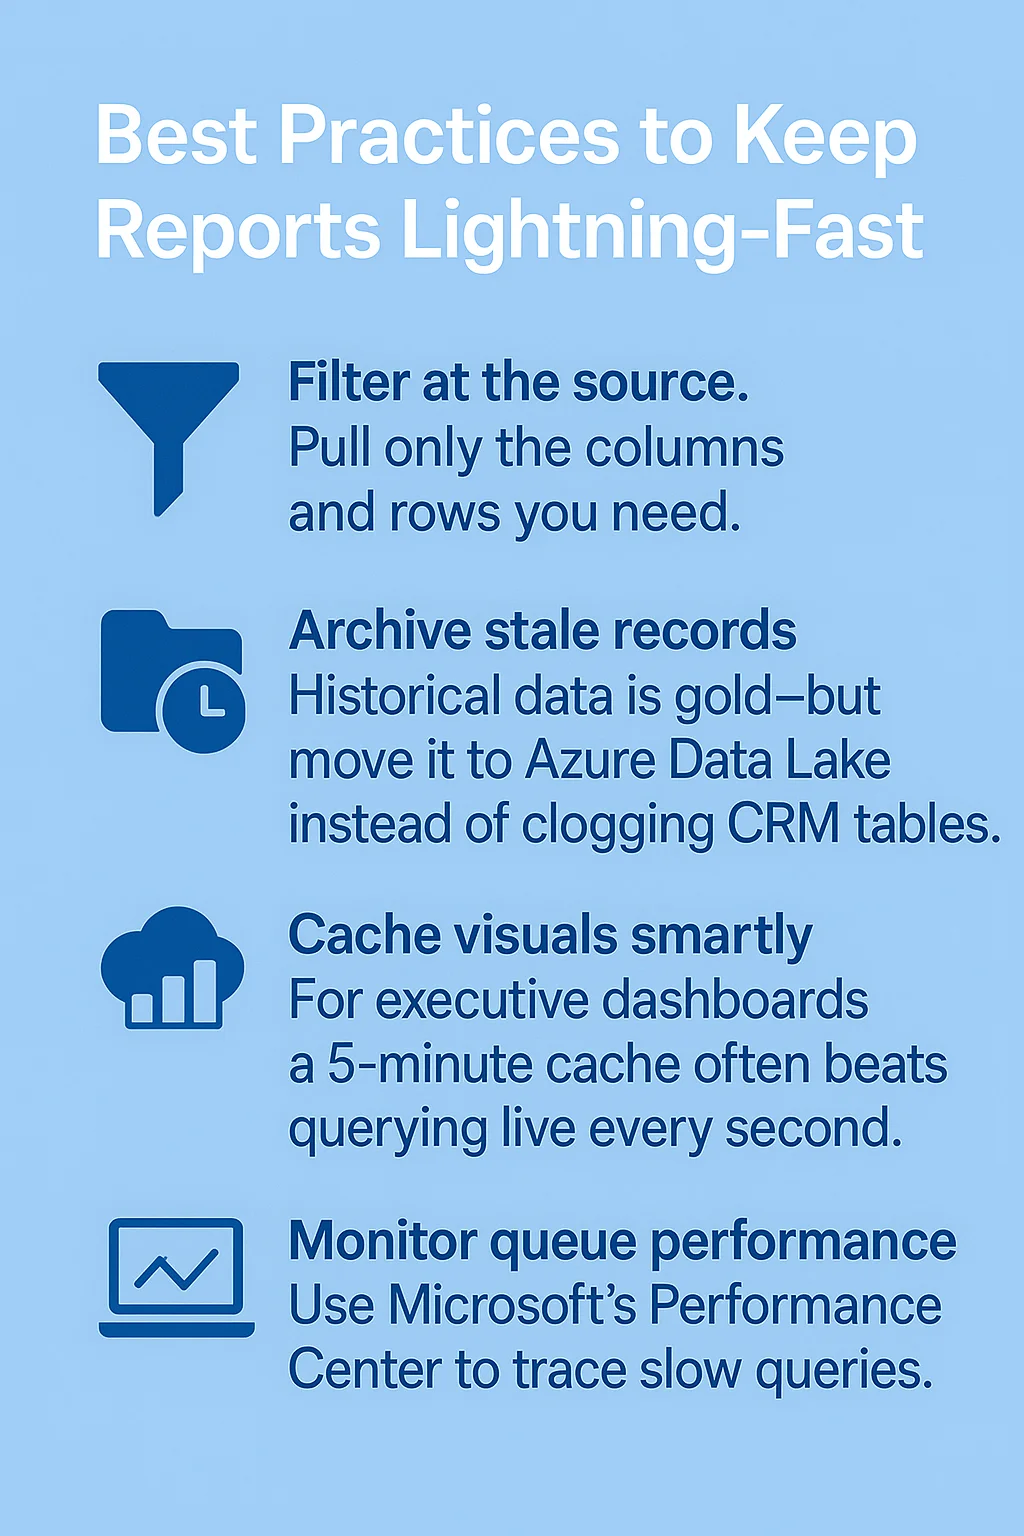
Best Practices to Keep Reports Lightning‑Fast
- Filter at the source. Pull only the columns and rows you need.
- Archive stale records. Historical data is gold—but move it to Azure Data Lake instead of clogging CRM tables.
- Cache visuals smartly. For executive dashboards, a 5‑minute cache often beats querying live every second.
- Monitor queue performance. Use Microsoft’s Performance Center to trace slow queries.
Next Steps: Turn Insights into Impact
Setting up your first custom report can feel daunting, yet the payoff is immediate. If you’d like expert guidance, the team at Skysoft Connections has delivered over 40,000 hours of Dynamics CRM and Power Platform projects with a 100 % success rate. Let us tailor dashboards that surface the metrics you care about—right when you need them.
Ready to see your data in real time? Book a free 30‑minute strategy call and start turning insights into results today.
Readmore : how dynamics crm is transforming modern marketing campaigns
FAQ’s
Custom reporting delivers real-time, relevant data tailored to your goals, helping teams make faster, data-backed decisions.
You can use built-in report wizards, Power BI integrations, and FetchXML-based reports to create flexible, dynamic dashboards.
Filter data at the source, archive old records, cache visuals wisely, and monitor performance using Microsoft’s Performance Center.
![]() is a software solution company that was established in 2016. Our quality services begin with experience and end with dedication. Our directors have more than 15 years of IT experience to handle various projects successfully. Our dedicated teams are available to help our clients streamline their business processes, enhance their customer support, automate their day-to-day tasks, and provide software solutions tailored to their specific needs. We are experts in Dynamics 365 and Power Platform services, whether you need Dynamics 365 implementation, customization, integration, data migration, training, or ongoing support.
is a software solution company that was established in 2016. Our quality services begin with experience and end with dedication. Our directors have more than 15 years of IT experience to handle various projects successfully. Our dedicated teams are available to help our clients streamline their business processes, enhance their customer support, automate their day-to-day tasks, and provide software solutions tailored to their specific needs. We are experts in Dynamics 365 and Power Platform services, whether you need Dynamics 365 implementation, customization, integration, data migration, training, or ongoing support.